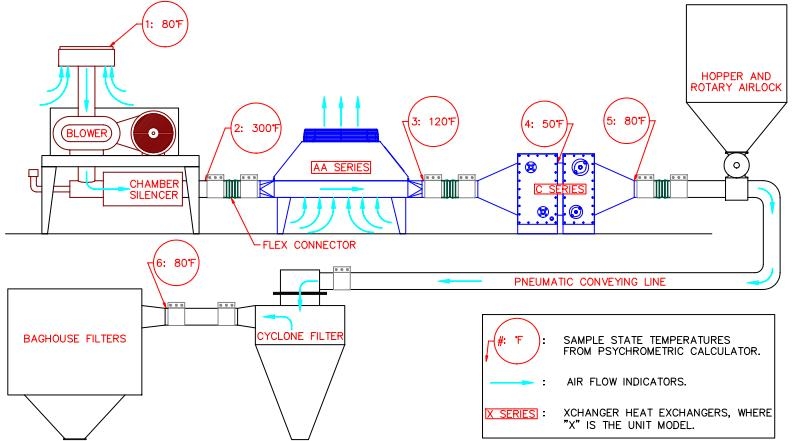
The six lines above correspond to six possible conditions in an gas system, listed in order of gas flow. For example the initial numbers could represent:
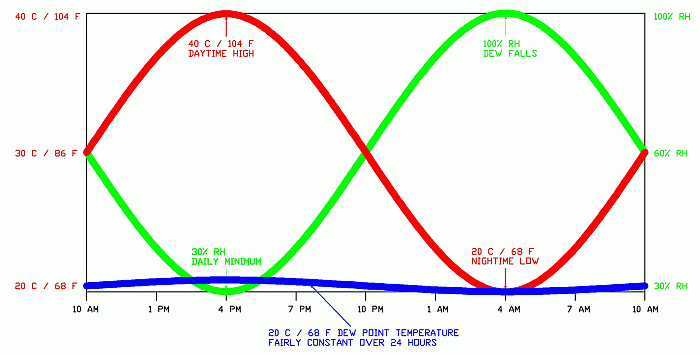
See this wikipedia article for more information on psychrometrics. Find weather data for your area on Climate Charts world-wide map: click on a nearby station to view a chart of average daily high and low temperatures. The dew point is typically somewhere between the high and low, often a few degrees above the daily low temperature. Another source is MyForecast: enter city, look under “Almanac” and “Historical Climate” for average high & dew point temperatures. The below graph of a typical 24 hour period with roughly the same absolute humidity (dew point) illustrates the inverse relationship between temperature and relative humidity.
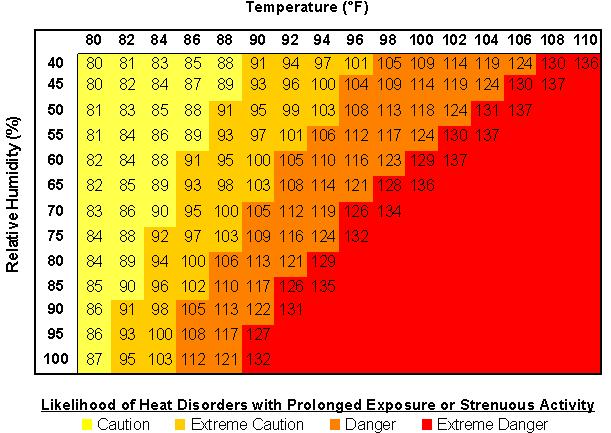
The heat index below gives some perspective on dew points. Beware of a specification of “100 F, 100% RH” …as you can see it’s off the chart; it simply does not happen. The highest dew point ever recorded was 95°F, in Dhahran, Saudi Arabia, on the Persian Gulf on July 8, 2003. In the USA, the highest dew points (above 80°F) occur near the Gulf of Mexico and in parts of the upper Mississippi Valley. Dew points higher than 80°F are rare and fleeting. The most humid USA design condition published by ASHRAE (American Society of Heating, Refrigeration & Air Conditioning Engineers) is Galveston, Tx: a 75.2 °F dew point, which is exceeded only 1% of the average summer, or about 30 hours.
NOAA’s National Weather Service Heat Index: